Showing posts with label BigData. Show all posts

Wednesday, 7 September 2016

Setting up spark on a multicluster Machine

  1. Spark work on a master - slave model. 
  2. Master Machine and Slave Machines required. You can have master and slave on same machine too. 
  3. For testing purpose you can generate the cluster on same machine , approach similar 
  4. In each machine check if Java is installed

    JAVA install/update 
  5. If you are using a new machine, ec2 it wont come preinstalled with Java.  
  6. You can set up Java following below steps
  7.  First update package index :
    1. sudo apt-get update
    2. check version java -version 
    3. If Java not found →  Install JRE 
      1. sudo apt-get install default-jre
      2. sudo apt-get install default-jdk
  8. check Java-version 
  9. This might install Java 1.6 
  10. sudo apt-get install openjdk-7-jre
  11. sudo apt-get isntall openjdk-7-jdk
  12. Issue : Java still points to version 6. 
  13. Follow below steps to update 
    1. update java-alternatives -l
    2. sudo update-java-alternatives s java1.7.0-openjdk-amd64 (your path to the newer) 

    Instance Setup 
  14. Login to Dev or EC2 instances 
  15. If Running on Ec2 Do the following:
    1. Create an account, generate private  and public key pairs download the keys to one of the machine. You can get those steps online on how to generate key pairs. 
    2. Create two system variables for AWS_ACCESS_KEY and AWS_SECRET_KEY
    3. Go to spark directory on your local machine  and run the ec2 script from ./sbin/ec2 file.
    4. ./spark-ec2 --key-pair=awskey --identity-file=awskey.pem --region=us-west-1 --zone=us-west-1a launch my-spark-cluster
    5. This will create two Large instances cluster. 

    SetUp Spark 
  16. Download Spark → Select Hadoop latest  Version and follow the link  
  17. For dev box : you can download using : 
    1. wget spark link 
    2. unzip using tar -xzf folder for spark
  18. Do this in all machines you want to run spark on .
  19. Set up env variable SPARK_HOME to point folder just before the bin directory, in normal case it will be the unzipped folder
  20. Save it using source ./bashrc
  21. Decide on which machine you want your master and slave


    Master Machine 
  22. Login to Master Machine, follow below steps
  23. edit hosts file for master
    1. vi /etc/hosts
    2. Provide the link between IP and name 
    3. IP Machine1
      IP Machine 2 
       
  24. Next few steps are changes in spark code
    1. slaves template is located in the conf directory.
    2. there is a file called slave template, same file can be used or a new file called you can create from that buy copying the content to slaves
    3. Paste the names of all slaves in this file 
      1. slave 1
      2. slave 2
      3. slave 3
  25. Go to Spark Sbin Directory 
    1. cd ./sbin/
    2. run ./sbin/start-master.sh
  26. This will start the master on port 8080, access it via IP address or Machine Name
  27. For current case go to any web browser and type :  http://machinename:8080
  28. This was required because you need to get the spark master address. When you go to the link it will show the url at the top spark://machinename:7077 
  29. Copy it 
  30. Go to /conf/spark-defaults.conf.template
  31. Add the masters url in the file 
  32. spark.master spark://machinename:7077 (it can also start with IP or a bigger name like machinename:7077
  33. Go to /sbin/spark-env.sh
  34. Add the following lines to it 
  35. export SPARK_WORKER_MEMORY=1g  You can specify how much memory you wanna give to worker 
    export SPARK_WORKER_INSTANCES=2 → No of workers
    export SPARK_MASTER_IP=spark-2 → Name of Spark master
    Slave
  36.  Go to slave Machine /sbin/start-slave.sh
  37. Run JPS in both slaves and master

Note : You need a password less access between master and  copy masters pub key defined in : id_rsa.pub move to authorized_key in slave and save. 

Very Useful links
http://blog.cloudera.com/blog/2015/03/how-to-tune-your-apache-spark-jobs-part-1/
http://blog.cloudera.com/blog/2015/05/working-with-apache-spark-or-how-i-learned-to-stop-worrying-and-love-the-shuffle/
https://www.codementor.io/spark/tutorial/spark-python-rdd-basics


Sunday, 19 July 2015

Data Analytics with R - World Bank Refugee Population data

Data Source :  World Bank Data
Problem :  To observe the distribution of refugees across the globe in past two decades.

Data Cleaning : Removed all countries with <100 people as refugees. Remove all unnecessary columns with no relevent data like Indicator name, Indicator code.

Step 1: 
1. Install R
2. IDE : RSTudio,
3. Online Editor : Data Joy.

4. Loading dataset in R:
df <- read.csv("data.csv", stringsAsFactors=FALSE)
this create an object by name mydf. Each cell in a CSV file is in a delimiter seperated format, mostly the delimiter is comma but there can be others as well.  The first row contains the header in this case “Country Name “, “Country Code” and the refugee population between years 1990-2013. We can prevent conversion of string to factor( A type) in R by setting stringAsFactors to false. By default it is true.


image
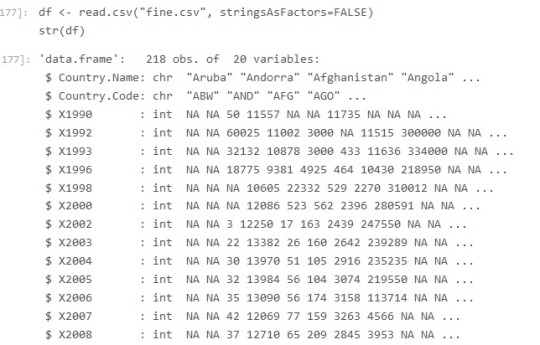
5. To check all the column names :
In the console type : 

  • str(df)This function compactly displays the Structure of an R Object.  All the column headers with data type wil be displayed.


image
2 char columns are Country Name and Code. The rest are number of people that seek refugee in the specific country.

6. To access columns of a dataframe,
You can use :

table(mydf$Country.Name)
To get header names use :
print(names(df))
Table command will return you a vector with value in column Country.Name and the count of that value, since these values are population of refugees, which is unique it gives you count 1.
Afghanistan                  Albania                  Algeria                                               1                                        1                          1
To get the proportion one can use :
prop.table(table(mydf$Country.Name))
Though not required for this data.
7.  Create a new column Category in the data frame
df$Category  <- mydf$Country.Code
8. To get the upper limit of our data, we need to get the maximum number of refugees by a country in particular column. For Year 2013 the maximum value can be extracted using:
max(df$X2013, na.rm = TRUE)
9. There are some countries in dataset where the columns are either not available or empty, resulting in a lot of “NA” in the data. Lets convert all Empty columns to a numerical value of 1(~0).
df[is.na(df)] <- 1
In ‘R’ the value is assigned using ‘<-‘ operator, this makes all ‘NA’ columns as 1.

10.  Since the dataset has  highly varying range of values, ranging from 1 to 2712888, I decide to categories them into different categories. The idea is to create a bucket distirbution. Each bucket will have some capacity, in this case say 10000.  


Bucket 1 : 1- 9999 (All entries between 1-9999 will be in this bucket.
Bucket 2:  10000-19999
and so on.

11. Now we have to loop through every cell value in the data frame and replace it with the bucket they fall into.

for(i in names(df)){if((i != colnames(df)[1]) && (i != colnames(df)[2]) && (i != colnames(df)[18])){
      sq<-seq(0,3000000,10000)
      qr<- cut(df[,i],sq,labels = c(1:300))
      df[,i]<-as.numeric(qr)
   }
}
Excluding all values in the first (Country Name column), second (Country Code column), last column which we created previously called Category.
R provides a method called cut: cut converts the range of values into intervals and assigns the values in x according to which interval they fall.
cut((x, breaks, labels = NULL, ...))
X : a numeric vector which is to be converted to a factor by cutting.

breaks : breaks either a numeric vector of two or more unique cut points
labels”  labels for the levels of the resulting category.
A intermediate factor vector is created for each column and the resulting value of the column is updated with it.  SInce this is a factor vector, the value is typecast to numeric in the next line. If the number of cut points doesn't match based on the cut, an error will be thrown “Length do not match”
No of cutpoint = Data Max Value / Capacity of bucket
12. Convert your data to long format as needed by ggplot
GGPlot is a graph plotting library of R.
Reshape2 is a transformation library.

Library(reshape2)
df.molten <- melt(df, value.name="Count", variable.name="Year", na.rm=TRUE)
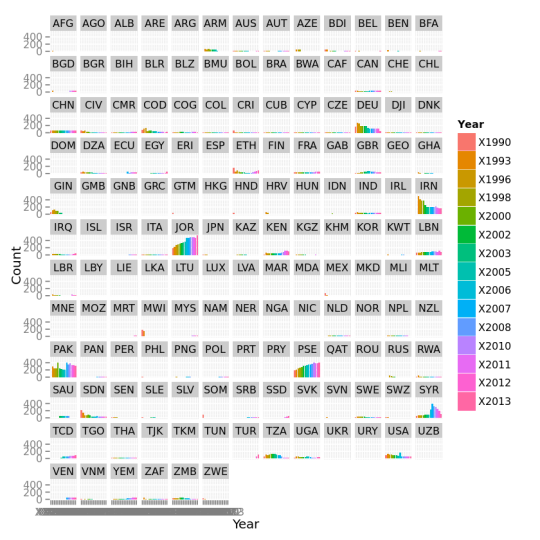
13. Plot the graph using ggplot’s qplot by categories.
par( mfrow = c(3,3) )

library(ggplot2)

qplot( data=df.molten, x = Year,y = Count, geom="bar", size = I(2),stat = "identity" ,las=0.3, cex.names=0.4) + facet_wrap( "Category" ) + geom_bar(width=1.5)


image

14. Some useful information retrieved from data :
a ) Number of refugees increasing every year.
b) Huge rise in number of refugees in European countries in last few years
c) Jordon, Pakistan, Iran and Germany has most number of refugees.
d) Sweden refugees are increasing at an alarming pace, but lesser then last few years.
e) Most of the countries are very much constant with the number of refugees they allow in their home country esp Chech Republic, Greece, India, and China,
f) In European countries Germany (Country Code - DEU) has the highest number of refugees.
g) There is a large uneven distribution of refugees across europe, some countries <1000 refugees and some numbers are too high.
h) United States also has a large number of refugee population and it is just second to Germany(excluding middle eastern states) in terms of numbers.
i) There has been sudden rise in number of refugees especially in Gaza, Syria, Canada, Britain.
f) Iran, Zimbabwe, Saudi Arabia Ghana has seen big decline in past few years .
g) The number if refugees in Saudi Arabia, UAE, Russia and Qatar are alarmingly low.
h) Number of refugees in Europe is rising. Germany, France, United Kingdom and Sweden and Turkey leads in number of refugees.

Friday, 24 April 2015

Tumblr Blog

My Tumblr Blog


Why I am moving to tumblr :
1. Lots of stuff to read
2. Simple to use.
3. 230 Million Blogs
4. No Charge.
5. Great Design optimized for Mobile.
6. Easier to get followers


7. I am joining Yahoo :)

My blog will remain active but most of the new post will be on tumblr.

Thursday, 12 March 2015

Spark Streaming

In my previous post I mentioned about Spark Stack. In this post I am to give a brief overview of the component Spark Streaming.
Spark Streaming is an extension to Apache Spark that allows processing of live streams of data.
Data in Spark can be ingested from Kafka, Flume, Twitter or TCP sockets. 

Live Data is broken into chunks/batches for predefined interval of time. Each chunk of data represents an RDD and is processed using RDD operations. Once the operations are performed the results are returned in chunks.
DStream is a basic abstraction in Spark Streaming. They represent a chunk of data and as such implemented as an RDD. Dstreams are created from streaming input sources like Kafka, Twitter etc or by applying transformation operations on existing DStream.
Spark Streaming

The incoming data as mentioned above is processed in predifined interval. All the data for any interval is stored across the cluster for that interval. This results in creation of a dataset. Once the time interval is completed dataset is processed using various operations. The operations could be map-reduce or join. 
Streaming Context is the main entry point of spark application.
val sc = new StreamingContext(sparkContext, seconds(1))
Using sc, Dstreams can be created that represents streaming data from input sources ex. TCP/Twitter. 
TCP
val sData = ssc.socketTextStream("1.2.3.4", 1000)
Here First parameter represents Ip address and second port number. sData represents Dstream of data that will be received from server.
Twitter
val tData = TwitterUtil.createStream(ssc, oauth)
Where oauth denotes the Oauth. Twitter uses Ouath for authorization requests.

Once this is done transformations are applied on the created RDD. One such transormation is flatMap. 
val hashTag = tData.flatMap(status => getTag(status))
val words = sData.flatMap(_.split(" "))
flatMap is an operation that is similar to map but each input is mapped to 0 or more output items resulting in a sequence of data as output. 


Thursday, 25 December 2014

Apache Spark a brief overview

Apache Spark a PHD resarch project at UCBerkley came into limelight when it broke the record of sorting petabyte of data recently.
Various Sorting Records.
Databrick


What is Spark ?
Apache Spark™ is a fast cluster computing framework and general engine for large-scale data processing.
Spark Goals:
Generality : Diverse workloads, operators, jobsizes.
Latency:Low Latency
Fault Tolerance


Spark supports Hadoop, Amazon S3, Cassandra, cluster management tools like YARN and Mesos. Spark does more In memory data processing as compared to DiskBased processing as in Hadoop.

Spark stack comes bundled with tools like Spark SQL, MLlib, Spark Streaming and GraphX.


  1. SparkSQL: Unified access to structured data , provides compatibility with Apace Hive and Standard Connectivity to tools like JDBC and ODBC.
  2. Spark Streaming:  For Scalable fault tolerant Streaming applications and spark can run in both batch and interactive mode.
  3. MLlib:Scalable Machine Learning library.
  4. GraphX:Large Scale Graph Processing Framework.
Learn More about Spark


Spark vs Hadoop

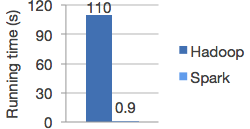
Spark is 100X times faster then Hadoop.
The speed can be attributed to the fact that Spark keeps the intermediate data cached in local JVM.  Hadoop on the other hand in the name of Fault Tolerance write the intermediate data on to the disk and disk is expensive.
                                                                                                               *Image from Spark


Spark doesnt replace anything in Hadoop Ecosystem rather it offers a readable, testable way to write programs freeing us from the painful Map Reduce jobs. MR model is unsuitable for Iterative algorithms. MR jobs are pain to program too. Although there are tools to reduce our efforts in writing MR jobs like Hive, Cascading etc but internally they call MR jobs thus not improving the performance.

Spark programming model
The main abstraction for computation in Spark is Resilient(Can start automatically) Distributed Datasets.

What is RDD ? 
RDD(Spark Paper) :
RDD's are fault-tolerant, parallel data structures that let users explicitly persist intermediate results in memory, control their partitioning to optimize data placement, and manipulate them using a rich set of operators.


Spark transformations applies same data operation to many data items. This results in better Fault tolerance as only the lineage of transformation is logged rather then the actual data. Also if some of RDD's are lost it has enough information to how it is derived from other  RDD's.
RDD can be created through Transformations(map,filter,join). Spark creates Direct Acyclic Graph of these transformation . Once the RDD's are defined through transformations , actions can be applied on them.
Actions are application that returns a value(count,collect and save). In Spark RDD's can be stored in disk by calling persist.
Since it is just an RDD it can be queried via SQL Interface, ML algos etc.

In short
User Program => 
Create Spark Context
sc = new SparkContest
Create Distributed Datasets called RDD's 
Perform Operations.

Inside spark context act as client and master per application.

Block tracker => What is in memory what is on Disk ?
Shuffle => Shuffle operation like Groupby

Scheduler talk through cluster manager talks to a worker.
Contains Block Manager for Block Mgmt.
Recieves task that run in thread pools.
Task can talk to HDFS.

Saturday, 3 May 2014

Simplifying the map reduce framework

Google MapReduce

What is Map Reduce ?
 Map Reduce is a model to process large amount of data in Parallel.Let user handle Computation aspects and hides the messy details of parallelization, fault tolerance,data distribution and load balancing .

Whats the programming model for MapReduce ?
Input <Key,Value> pair  -> Output <key,Value>pairs.
Map and Reduce two functions.
Map takes input pair,producing intermediate key value pair.
Group all intermediate values assiciated with same intermediate key k and pass it to Reduce funtion.

Reduce function :  Merge these intermediate values producing a smaller set if values.
 

What are some of the examples? 
Word Count. Count all occurrence of words in a set of documents. 
Map funciton -> each word plus an associated count..
Reduce function -> sum together all counts emitted.

Distributed Grep :  Map : Emits line if matches specific pattern, 
reduce identity function ,copies data to output.   

Count of URL access frequency : 
Map : Logs of web page request outputs <URL,1>
Reduce : Adds all values for the same URL <URL,total count>

Reverse Web Link Graph : 
Map: outout<target,source>
Link pairs target url found on source.  
Reduce : sums all source URL associated with a target.

Distributed Sort
Machine Learning.

What are the steps invloved in Map Reduce ?
1.Split the input file into M pieces of 16 MB or 64 MB.Starts many copies on cluster machine.
2.Follows master and slave model.1 Master many slaves or workers. Master  asssigns idle workers a task from M map and R reduce tasks.
3.Map worker reads input split . generate key value pair form it,pass it to Map function.
4.Map produces intermediate <Key,Value>pair which are buffered in memory.
5. Buffered pairs written to local disk periodically.Local disk partioned into R regions by partitioning function.
6.Location of these passed passed bak to master who forward these to workers.
7.Worker when recieves notification of a location, uses RPC to read buffered data from buffered Disk. Sort the data by intermediate key for grouping.
8.Reduce worker , iterates over sorted intermediate key and for each unique key it passes the <key,Value> pair to reduce function.
9.Writes the output to files.
 
Master :
Stores state(Idle,in-progress or compleated) and identity of worker machine.


Why Combiner Function ?
A mapper function(WOrdCount) produces output in the form <'the',1> with word and its count.  This output is then sent over the network to a single reduce task and clubbed together to produce as many output files as the number of reducer function.
Combiner function does parital merging of data ,before it is sent over the network. Combiner function runs on each machine that has Mapper funciton.
Combiner function significantly speeds up the MapReduce operation by minimizing the number of <k,v> pair that will be sent over the network therby improving the bandwidth. Combiner code is similar to Reducer. 

Saturday, 1 March 2014

Keyword Analysis on Apache Hadoop Issue Tracker

In my recent project titled "Recommending similar defects and Effort Estimate for Apache Hadoop Issue Tracker"
I recently wrote python code to extract most used hadoop specific keywords in the issue tracker after removing irrelevant words and stop words from the list.
I am classifying them into various classes like HDFS Hadoop Error MINING DataNode etc Some of the words that is found on the list are posted.
Click for the word list


List has approximately 4700 words .
Duplicate words were removed from the list.
The list analyzed first 200 defects from Hadoop Commons and Hadoop HDFS.
Both Summary and Description of the defects were analyzed and were selected based on their need on the defect analysis.


The stop word list is prepared by combining various lists available online like FoxStoplist.txt  
stopwords-lists 
I believe that this list might be useful for someone working on Language Processing for Issue related words and Hadoop Specific words.  
Defect Example : HDFS : 6001  
Description : When hdfs is set up with HA enable, FileSystem.getUri returns hdfs:// Here dfs.nameservices is defined when HA is enabled.
In documentation: This is probably ok or even intended. But a caller may further process the URI, for example, call URI.getHost(). This will return the 'mycluster', which is not a valid host anywhere.
Summary : In HDFS HA setup, FileSystem.getUri returns hdfs://  


Keywords : #Hdfs #dfs.nameservices # FileSystem #getUri #Nameservices #host #URIL #HA #returns

Saturday, 22 February 2014

Supervised Learning : A Mathematical Foundation

Supervised Learning as per Wiki

Supervised learning is the machine learning task of inferring a function from labeled training data. The training data consist of a set of training examples. In supervised learning, each example is a pair consisting of an input object (typically a vector) and a desired output value (also called the supervisory signal). A supervised learning algorithm analyzes the training data and produces an inferred function, which can be used for mapping new examples. An optimal scenario will allow for the algorithm to correctly determine the class labels for unseen instances.


In Short : Learning from historical data a mapping between input and output variables and applying this to predict output for an unseen data.

STEPS of SUPERVISED LEARNING

  • Determine type of training example
    • What kind of data to be used.
      • Handwriting analysis : single handwritten character, word,line
  • Gather a Training set
  • Determine Input feature representation of learned function.
    • Input object transformed into feature vector.
  • Determine structure of learned function and corresponding learning algorithm.
    • SVM or DT
  • Complete the design.
    • Run Algorithm on Training set.
  • Evaluate accuracy.

 Mathematics behind Supervised Learning

Goal : Infer a function
f : X Y
Classifier from sample data An
An = ((x1, y1), ..., (xn, yn)) ∈ (X × Y )n.
Input and Output points xi and yi Y 


yi IR for regression problems, and yi is discrete for classification problems {-1, +1}

 
2 Hypothesis : 
1)Find a function f to model depandency in P(x,y) 
2)Error or loss between prediction f(x) desired output y.  

Loss function : L : Y ×Y IR+

If Binary Classification Y in {-1,+1}   L( h (x), y)) = 1/2 | h(x) − y|.
Unsupervised Learning a function can be
Lu( h(x)) = log( h(x)).
 Risk for a function or Generalization Error 

R( h ) =    L( h(x), y)dP(x, y). 
Classification : Function f that minimises R(f) but joint probablity P(x,y) unknown
 Using Input and Random variables Risk can be written as 

R(h) = \mathbf{E}[L(h(x), y)] = \int L(h(x), y)\,dP(x, y).


Empirical Risk Minimisation : 

Learning algo find Hypothesis h such that R(h) minimum


h^* = \arg \min_{h \in \mathcal{H}} R(h).
R(h) cannot be computed  so approximation Empirical Risk by leveraging loss  


\! R_\mbox{emp}(h) = \frac{1}{m} \sum_{i=1}^m L(h(x_i), y_i).
for Large numbers As m goes to infinity point wise convergence of h to R(h)
Minimise Rem
\hat{h} = \arg \min_{h \in \mathcal{H}} R_{\mbox{emp}}(h). 
 
Consistency is important : 
 
Thus learning depands upon function h or f in above case 
It has to have smooth boundries , regularization is applied : Regularization theory.

Regularized Risk : 
Ω ( f ) : Roughness Penalty


Risk Bounds 

H , An and δ , such that, for any f ∈ H , with a probability at least 1 − δ :
 
consider the case of a finite class of functions, |H | = N.   
Hoeffding Inequality by summing over set : 
  Risk =  sum of 2 terms : Empirical error and bound depand on size.
 As n -> infintiy second term tends to 0
Bias Variance Dilemma
H large one can find f that fits the data but noise due to large points resulting in poor performance 
Called Overfitting 

Overfitting according to Wiki
Generally, a learning algorithm is said to overfit relative to a simpler one if it is more accurate in fitting known data (hindsight) but less accurate in predicting new data (foresight).

VC dimension
Measure of capacity of function to different label of class


STRUCTURAL RISK MINIMISATION
Structural risk minimization seeks to prevent overfitting by incorporating a regularization penalty into the optimization. The regularization penalty can be viewed as implementing a form of Occam's razor that prefers simpler functions over more complex ones


select classifier that maximizes gamma  .


*Formulas taken from paper by cunningham  
http://tinyurl.com/ll4jxhq