Use Case and Dataset
The most important part of any machine learning application is to get the right dataset. As I am very much interested in Soccer, I thought of using the previous Premier league to predict winner of this season.
I agree that winner prediction is arguable and its hard to predict the winners due to so many factors associated, but I just want to try my hands on the new machine learning framework released by amazon few days back called “AWS Machine Learning ”.
Steps :
1. Download last 5 years of Premier League data from the website (2010-2015).
2. Data From (2010-2014) will be the training data.
3. 2015 will be the test data.
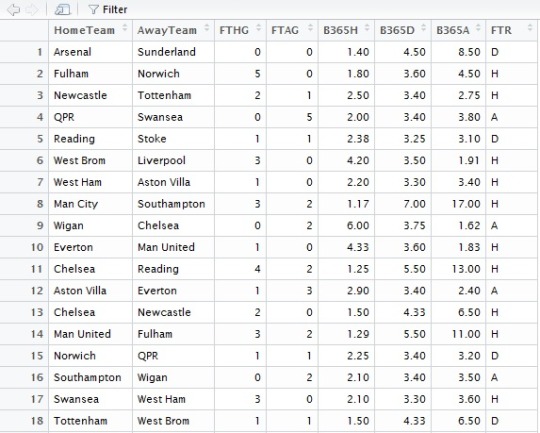
4. Extract following information from dataset
HomeTeam = Home TeamThe reason I want to include Bet365 is because I think bets tell a lot about the current performance of the team which the match result doesn't tell.
AwayTeam = Away Team
FTHG = Full Time Home Team Goals
FTAG = Full Time Away Team Goals
FTR = Full Time Result (H=Home Win, D=Draw, A=Away Win)
B365H = Bet365 home win odds
B365D = Bet365 draw odds
B365A = Bet365 away win odds
5. Combine all 4 files of dataset into one.
file1 <- read.csv("~/My Received Files/2010.csv", header = TRUE, stringsAsFactors = FALSE)
file2 <- read.csv("~/My Received Files/2011.csv", header = TRUE, stringsAsFactors = FALSE)
file3 <- read.csv("~/My Received Files/2012.csv", header = TRUE, stringsAsFactors = FALSE)
file4 <- read.csv("~/My Received Files/2013.csv", header = TRUE, stringsAsFactors = FALSE)
file5 <- read.csv("~/My Received Files/2014.csv", header = TRUE, stringsAsFactors = FALSE)
f1f2 <- rbind(file1, file2)
f4f5 <- rbind(file4, file5)
f1clean <- f1f2[,c(3,4,5,6,24,25,26,7)]
f2clean <- f4f5[,c(3,4,5,6,24,25,26,7)]
f3clean <- file3[,c(3,4,5,6,23,24,25,7)]
f2combine <- rbind(f1clean, f2clean)
finalfile <- rbind(f3clean, f2combine)

6. Save the dataframe to CSV file
write.csv(finalfile ,"~/My Received Files/test.csv")
7. Sort in alphabetical order.
teams = sort(unique(c(as.character(finalfile$HomeTeam), as.character(finalfile$AwayTeam))))
8. Create a table to store the wins and point record of each team. For that we create an empty data frame called final table with below columns.
finaltable = data.frame(Team = teams,9. Store in the above table count of matches all teams we can use the function as.numeric for that
Games = 0, Win = 0, Draw = 0, Loss = 0, PercentWins=0,
HomeGames = 0, HomeWin = 0, HomeDraw = 0, HomeLoss = 0, percentHomeWins =0,
AwayGames = 0, AwayWin = 0, AwayDraw = 0, AwayLoss = 0, percentAwayWins =0)
finaltable$HomeGames = as.numeric(table(finalfile$HomeTeam))10. Fill other columns based on values.
finaltable$AwayGames = as.numeric(table(finalfile$AwayTeam))
The values can be filled using FTR. Extract the hometeam column of the dataset and see if the FTR column is H, D or A. Group all these together first based on FTR H then based on team. Similarly for D and A. and also for win and loss.
finaltable$HomeWin =11. Calculate total wins, games,draw and loss. by adding the total for Home and Away games.
as.numeric(table(finalfile$HomeTeam[finalfile$FTR == "H"]))
finaltable$HomeDraw =
as.numeric(table(finalfile$HomeTeam[finalfile$FTR == "D"]))
finaltable$HomeLoss =
as.numeric(table(finalfile$HomeTeam[finalfile$FTR == "A"]))
finaltable$AwayWin =
as.numeric(table(finalfile$AwayTeam[finalfile$FTR == "A"]))
finaltable$AwayDraw =
as.numeric(table(finalfile$AwayTeam[f7$FTR == "D"]))
finaltable$AwayLoss =
as.numeric(table(finalfile$AwayTeam[f7$FTR == "H"]))
finaltable$Games = finaltable$HomeGames + finaltable$AwayGames12. Calculate percent wins for total, home and away wins.
finaltable$Win = finaltable$HomeWin + finaltable$AwayWin
finaltable$Draw = finaltable$HomeDraw + finaltable$AwayDraw
finaltable$Loss = finaltable$HomeLoss + finaltable$AwayLoss
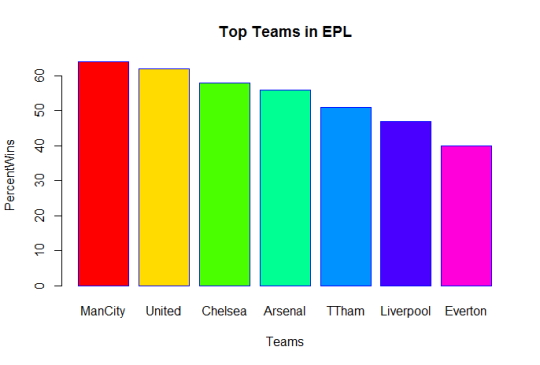
finaltable$PercentWins = floor((finaltable$Win / finaltable$Games)*100)13. Simply graph to extract top 10 teams
finaltable$percentHomeWins = (finaltable$HomeWin / finaltable$HomeGames)*100
finaltable$percentAwayWins = (finaltable$AwayWin / finaltable$AwayGames)*100
finaltable = finaltable[order(-finaltable$PercentWins),]
graphtable = finaltable[1:7,]
graphdata = finaltable[,c(1,5,10,15)]
barplot(graphtable$PercentWins, main="Top Teams in EPL by percent wins", xlab="Teams",
ylab="PercentWins", names.arg=c("ManCity","United","Chelsea","Arsenal","TTham","Liverpool","Everton"),
border="blue",col=rainbow(7),fill = rainbow(7))

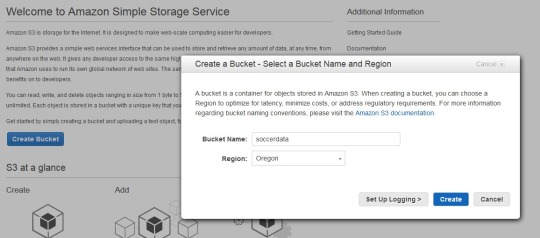
14. Add data to S3.Since AWS ML uses S3 as data storage, you need to upload your data to S3. Create a bucket in S3 and upload the dataset created above to it. This is our test data and all predictions will be based on it. Our dataset is in CSV format as required by AWSML

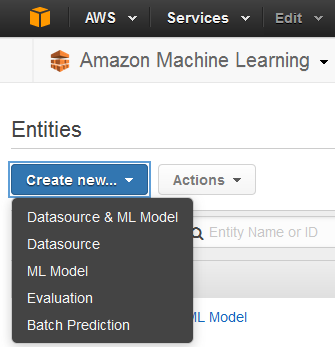
Next step is to create a ML model and link the S3 dataset.
Create new datasource. You can specify data location to be either S3 or redshift.
