.jpg)
Confusion Matrix is a tabular layout that can be used to measure the performance of an algorithm. Each Column represents predicted value and each row represents actual value.
Lets take an example of testing a person for cancer.
If the person has cancer , the test will say it as positive and if not then negative.
There are can be 4 outcomes if we consider test as an experiment.
1) The patients were suffering from cancer and our test recognized them as suffering from Cancer : These are called TRUE POSITIVE.
2) The patients were suffering from cancer but tests showed negative : These are called TRUE NEGATIVE
3) Patients who were healthy but were diagnosed as suffering from Cancer : FALSE POSITIVE
4) Patients who were not suffering from cancer and test said the same : FALSE NEGATIVE.
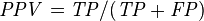
Precision (Positive Predicted Value) : proportion of patients test showed as having cancer and they actually had cancer.
Recall(True Positive Rate) : proportion of patients that actually had Cancer were diagnosed by test as having cancer. :

Precision and Recall Inversely Related
Accuracy :
Ratio of Correctly classified instances to total instances.
In layman terms : Number of times the test were right

Where P and N are total number of tests.
F1 : is a measure that combines the precision and recall rates by computing the harmonic mean between them. F-Measure does not consider True Negatives into account.

ROC Curve
Receiver Operating Curve(ROC) is a plot to show change in performance of Binary Classifier with change in Threshold. The graphs are plotted as the fraction of true positive by total actual positive called the TRUE POSITIVE RATE and true negatives by total actual negatives also called the TRUE NEGATIVE RATE. Values range between 0 and 1.

No comments:
Post a Comment