Confusion Matrix is a tabular layout that can be used to measure the performance of an algorithm. Each Column represents predicted value and each row represents actual value.
Lets take an example of testing a person for cancer.
If the person has cancer , the test will say it as positive and if not then negative.
There are can be 4 outcomes if we consider test as an experiment.
1) The patients were suffering from cancer and our test recognized them as suffering from Cancer : These are called TRUE POSITIVE.
2) The patients were suffering from cancer but tests showed negative : These are called TRUE NEGATIVE
3) Patients who were healthy but were diagnosed as suffering from Cancer : FALSE POSITIVE
4) Patients who were not suffering from cancer and test said the same : FALSE NEGATIVE.
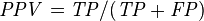
Precision (Positive Predicted Value) : proportion of patients test showed as having cancer and they actually had cancer.
Recall(True Positive Rate) : proportion of patients that actually had Cancer were diagnosed by test as having cancer. :
Precision and Recall Inversely Related
Accuracy :
Ratio of Correctly classified instances to total instances.
In layman terms : Number of times the test were right
Where P and N are total number of tests.
F1 : is a measure that combines the precision and recall rates by computing the harmonic mean between them. F-Measure does not consider True Negatives into account.
ROC Curve
Receiver Operating Curve(ROC) is a plot to show change in performance of Binary Classifier with change in Threshold. The graphs are plotted as the fraction of true positive by total actual positive called the TRUE POSITIVE RATE and true negatives by total actual negatives also called the TRUE NEGATIVE RATE. Values range between 0 and 1.
Google MapReduce
What is Map Reduce ?
Map Reduce is a model to process large amount of data in Parallel.Let user handle Computation aspects and hides the messy details of parallelization, fault tolerance,data distribution and load balancing .
Whats the programming model for MapReduce ?
Input <Key,Value> pair -> Output <key,Value>pairs.
Map and Reduce two functions.
Map takes input pair,producing intermediate key value pair.
Group all intermediate values assiciated with same intermediate key k and pass it to Reduce funtion.
Reduce function : Merge these intermediate values producing a smaller set if values.
What are some of the examples?
Word Count. Count all occurrence of words in a set of documents.
Map funciton -> each word plus an associated count..
Reduce function -> sum together all counts emitted.
Distributed Grep : Map : Emits line if matches specific pattern,
reduce identity function ,copies data to output.
Count of URL access frequency :
Map : Logs of web page request outputs <URL,1>
Reduce : Adds all values for the same URL <URL,total count>
Reverse Web Link Graph :
Map: outout<target,source>
Link pairs target url found on source.
Reduce : sums all source URL associated with a target.
Distributed Sort
Machine Learning.
What are the steps invloved in Map Reduce ?
1.Split the input file into M pieces of 16 MB or 64 MB.Starts many copies on cluster machine.
2.Follows master and slave model.1 Master many slaves or workers. Master asssigns idle workers a task from M map and R reduce tasks.
3.Map worker reads input split . generate key value pair form it,pass it to Map function.
4.Map produces intermediate <Key,Value>pair which are buffered in memory.
5. Buffered pairs written to local disk periodically.Local disk partioned into R regions by partitioning function.
6.Location of these passed passed bak to master who forward these to workers.
7.Worker when recieves notification of a location, uses RPC to read buffered data from buffered Disk. Sort the data by intermediate key for grouping.
8.Reduce worker , iterates over sorted intermediate key and for each unique key it passes the <key,Value> pair to reduce function.
9.Writes the output to files.
Master :
Stores state(Idle,in-progress or compleated) and identity of worker machine.
Why Combiner Function ?
A mapper function(WOrdCount) produces output in the form <'the',1> with word and its count. This output is then sent over the network to a single reduce task and clubbed together to produce as many output files as the number of reducer function.
Combiner function does parital merging of data ,before it is sent over the network. Combiner function runs on each machine that has Mapper funciton.
Combiner function significantly speeds up the MapReduce operation by minimizing the number of <k,v> pair that will be sent over the network therby improving the bandwidth. Combiner code is similar to Reducer.
.jpg)


