Problem : To observe the distribution of refugees across the globe in past two decades.
Data Cleaning : Removed all countries with <100 people as refugees. Remove all unnecessary columns with no relevent data like Indicator name, Indicator code.
Step 1:
1. Install R
2. IDE : RSTudio,
3. Online Editor : Data Joy.
4. Loading dataset in R:
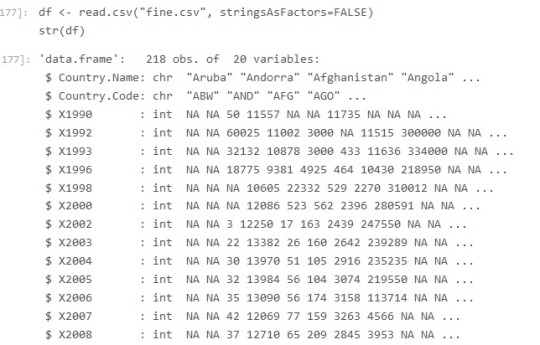
this create an object by name mydf. Each cell in a CSV file is in a delimiter seperated format, mostly the delimiter is comma but there can be others as well. The first row contains the header in this case “Country Name “, “Country Code” and the refugee population between years 1990-2013. We can prevent conversion of string to factor( A type) in R by setting stringAsFactors to false. By default it is true.df <- read.csv("data.csv", stringsAsFactors=FALSE)

In the console type :
- str(df)This function compactly displays the Structure of an R Object. All the column headers with data type wil be displayed.
6. To access columns of a dataframe,
You can use :
To get header names use :table(mydf$Country.Name)
Table command will return you a vector with value in column Country.Name and the count of that value, since these values are population of refugees, which is unique it gives you count 1.print(names(df))
To get the proportion one can use :Afghanistan Albania Algeria 1 1 1
Though not required for this data.prop.table(table(mydf$Country.Name))
7. Create a new column Category in the data frame
8. To get the upper limit of our data, we need to get the maximum number of refugees by a country in particular column. For Year 2013 the maximum value can be extracted using:df$Category <- mydf$Country.Code
9. There are some countries in dataset where the columns are either not available or empty, resulting in a lot of “NA” in the data. Lets convert all Empty columns to a numerical value of 1(~0).max(df$X2013, na.rm = TRUE)
In ‘R’ the value is assigned using ‘<-‘ operator, this makes all ‘NA’ columns as 1.df[is.na(df)] <- 1
10. Since the dataset has highly varying range of values, ranging from 1 to 2712888, I decide to categories them into different categories. The idea is to create a bucket distirbution. Each bucket will have some capacity, in this case say 10000.
Bucket 1 : 1- 9999 (All entries between 1-9999 will be in this bucket.
Bucket 2: 10000-19999
and so on.
11. Now we have to loop through every cell value in the data frame and replace it with the bucket they fall into.
Excluding all values in the first (Country Name column), second (Country Code column), last column which we created previously called Category.for(i in names(df)){if((i != colnames(df)[1]) && (i != colnames(df)[2]) && (i != colnames(df)[18])){sq<-seq(0,3000000,10000)
qr<- cut(df[,i],sq,labels = c(1:300))
df[,i]<-as.numeric(qr)
}
}
R provides a method called cut: cut converts the range of values into intervals and assigns the values in x according to which interval they fall.
A intermediate factor vector is created for each column and the resulting value of the column is updated with it. SInce this is a factor vector, the value is typecast to numeric in the next line. If the number of cut points doesn't match based on the cut, an error will be thrown “Length do not match”cut((x, breaks, labels = NULL, ...))
X : a numeric vector which is to be converted to a factor by cutting.
breaks : breaks either a numeric vector of two or more unique cut points
labels” labels for the levels of the resulting category.
12. Convert your data to long format as needed by ggplotNo of cutpoint = Data Max Value / Capacity of bucket
GGPlot is a graph plotting library of R.
Reshape2 is a transformation library.
13. Plot the graph using ggplot’s qplot by categories.Library(reshape2)
df.molten <- melt(df, value.name="Count", variable.name="Year", na.rm=TRUE)
par( mfrow = c(3,3) )
library(ggplot2)
qplot( data=df.molten, x = Year,y = Count, geom="bar", size = I(2),stat = "identity" ,las=0.3, cex.names=0.4) + facet_wrap( "Category" ) + geom_bar(width=1.5)
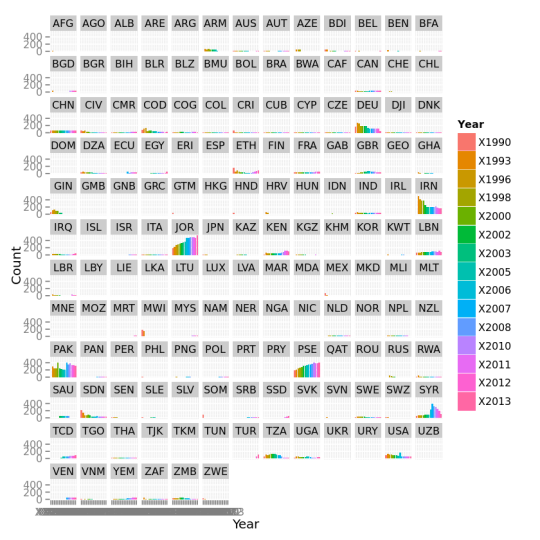
14. Some useful information retrieved from data :
a ) Number of refugees increasing every year.
b) Huge rise in number of refugees in European countries in last few years
c) Jordon, Pakistan, Iran and Germany has most number of refugees.
d) Sweden refugees are increasing at an alarming pace, but lesser then last few years.
e) Most of the countries are very much constant with the number of refugees they allow in their home country esp Chech Republic, Greece, India, and China,
f) In European countries Germany (Country Code - DEU) has the highest number of refugees.
g) There is a large uneven distribution of refugees across europe, some countries <1000 refugees and some numbers are too high.
h) United States also has a large number of refugee population and it is just second to Germany(excluding middle eastern states) in terms of numbers.
i) There has been sudden rise in number of refugees especially in Gaza, Syria, Canada, Britain.
f) Iran, Zimbabwe, Saudi Arabia Ghana has seen big decline in past few years .
g) The number if refugees in Saudi Arabia, UAE, Russia and Qatar are alarmingly low.
h) Number of refugees in Europe is rising. Germany, France, United Kingdom and Sweden and Turkey leads in number of refugees.